The Bollinger Bands indicator represents current market fluctuations and is used to demonstrate changes in market direction, predict the possibility of a continuation or cessation of a trend, as well as consolidation periods and rising volumes, while also indicating highs and lows.
Use Of Bollinger Bands
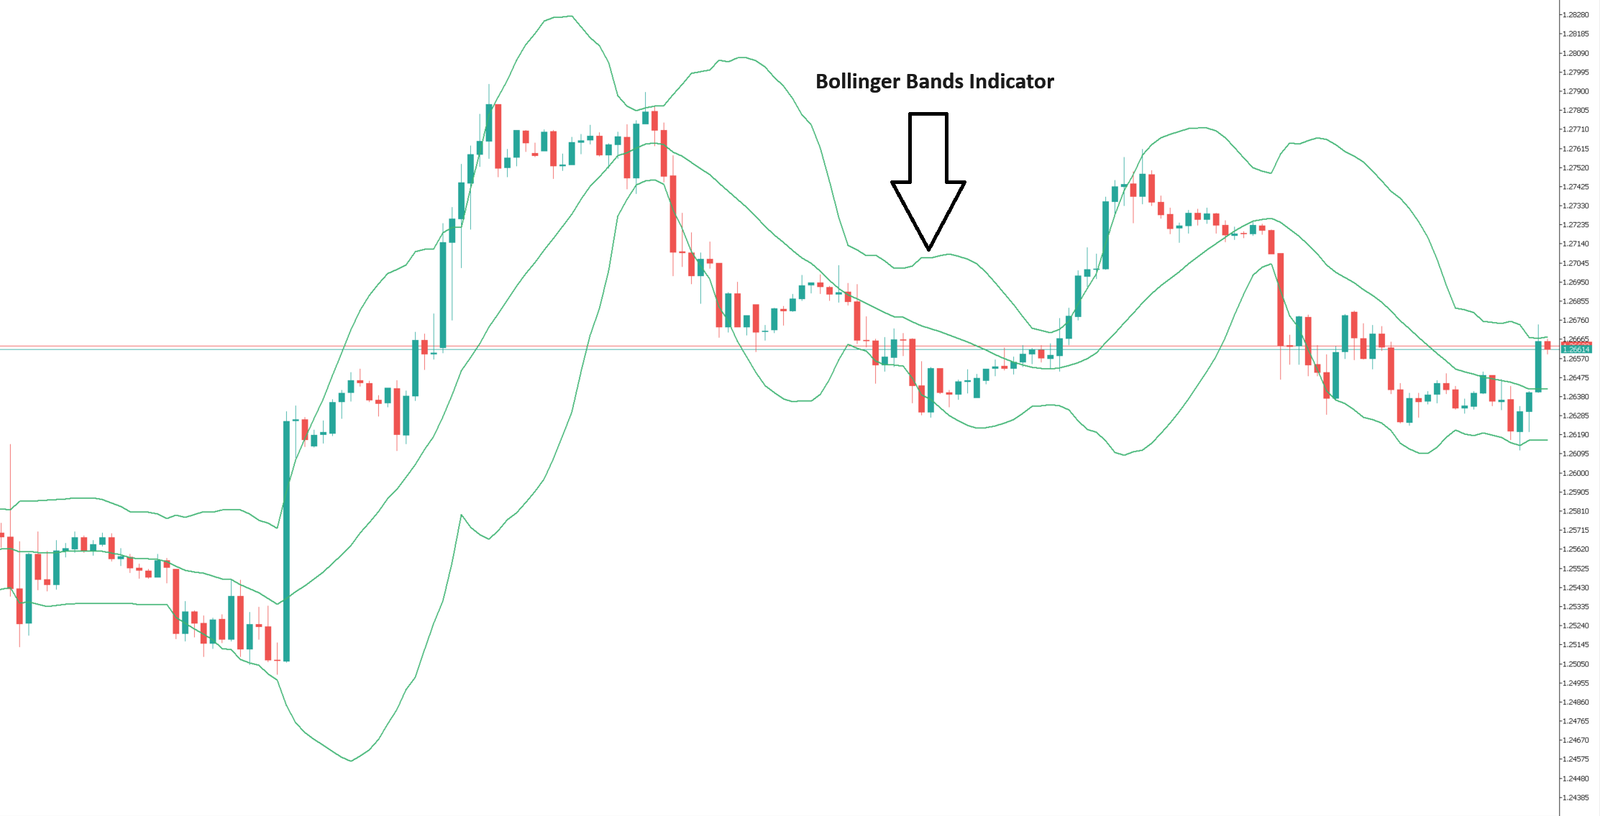
The Bollinger Bands indicator has three moving averages:
Upper Moving Average – 20-day moving average plus 2 times the standard deviation.
Moving average – 20-day moving average.
Lower moving average – 20-day moving average minus 2 times the standard deviation.
The range between the upper and lower moving averages increases, and both trading fluctuations increase, which means that the trend direction is stable, the same as the moving average. If the range between the upper and lower moving averages decreases, lower trading volatility means sideways movement.
A price breakout of the upper or lower moving average may indicate that the trend continues to develop (trading volatility increases and the moving average range expands), or that the trend reverses. Regardless, Bollinger Bands require further confirmation via other indicators (RSI, ADX or MACD).
Secondly, if the price breaks through or exceeds the moving average, it will indicate a buy/sell signal.