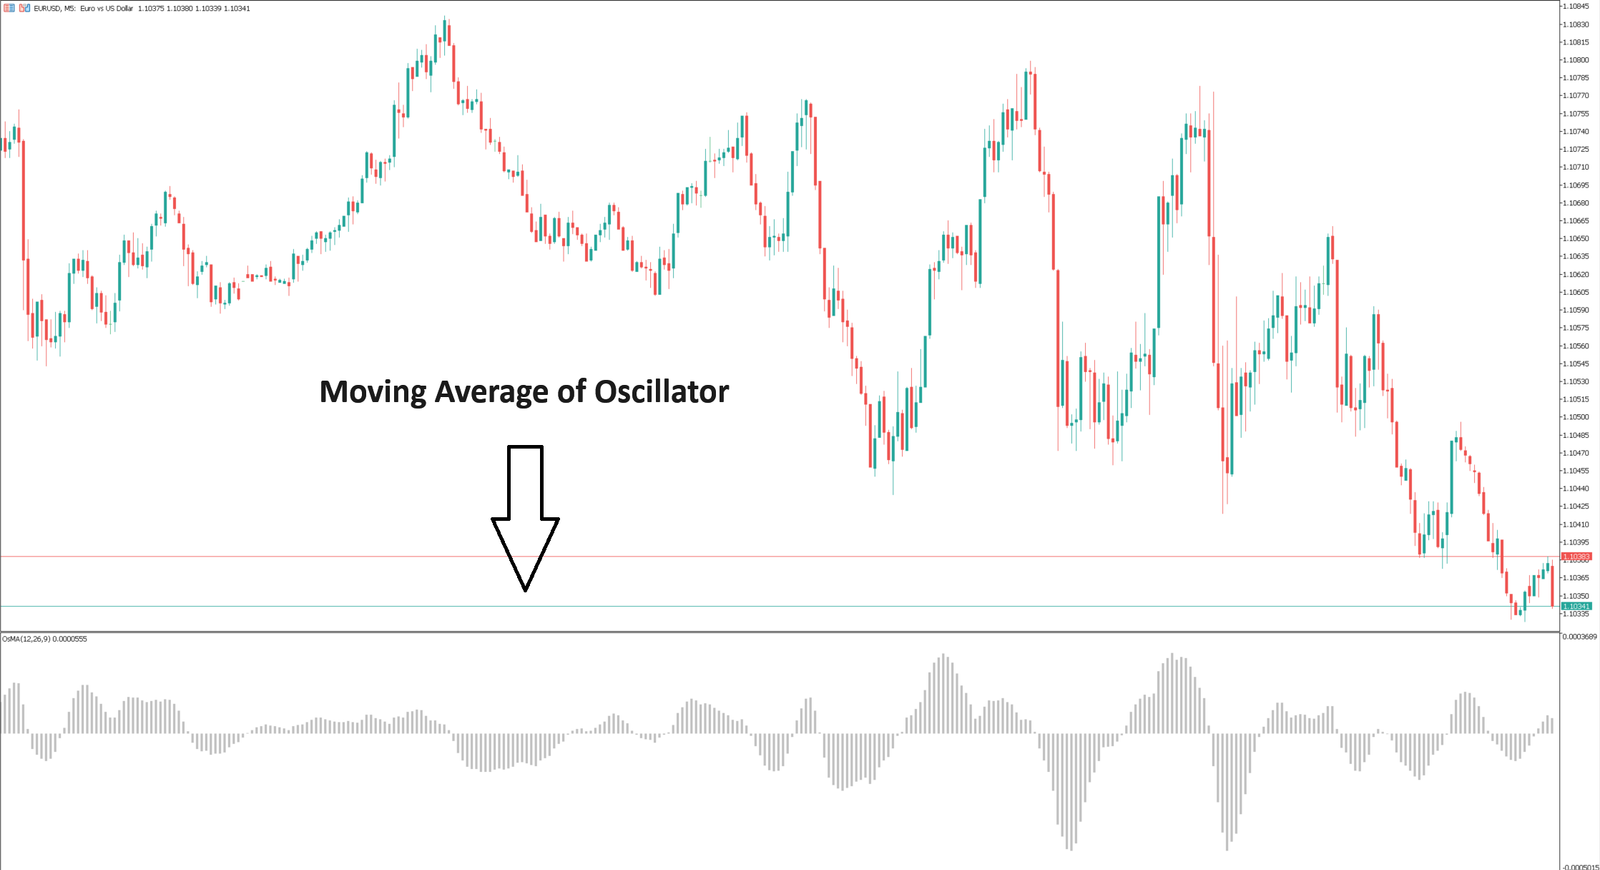
The oscillator moving average (OsMA) is a technical analysis tool that is the difference between the oscillator index (MACD) and its moving average (signal line).
Use of OsMA Indicator
Change the direction of movement
1-If the OsMA stops falling and starts to rise, especially far away from the zero axis, this means that the price may reverse and rise;
2-If the OsMA stops rising and starts falling, especially far away from the zero axis, it means that the price may reverse and fall;.
Intersects the zero axis:
1-OsMA rising above the zero line (MACD crossing the signal line upward) is a buy signal;
2-OsMA falling below the zero line (MACD crossing the signal line downward) is a signal to sell.
calculate
OsMA = MACD – Signal
OsMA Indicator | Moving Average Oscillator