The Average Trend Index (ADX indicator) was invented by Wells Wilder. This indicator determines the strength of the trend and future fluctuations in the price through the analysis of high and low values during dynamic trading periods.
Use of ADX Indicator
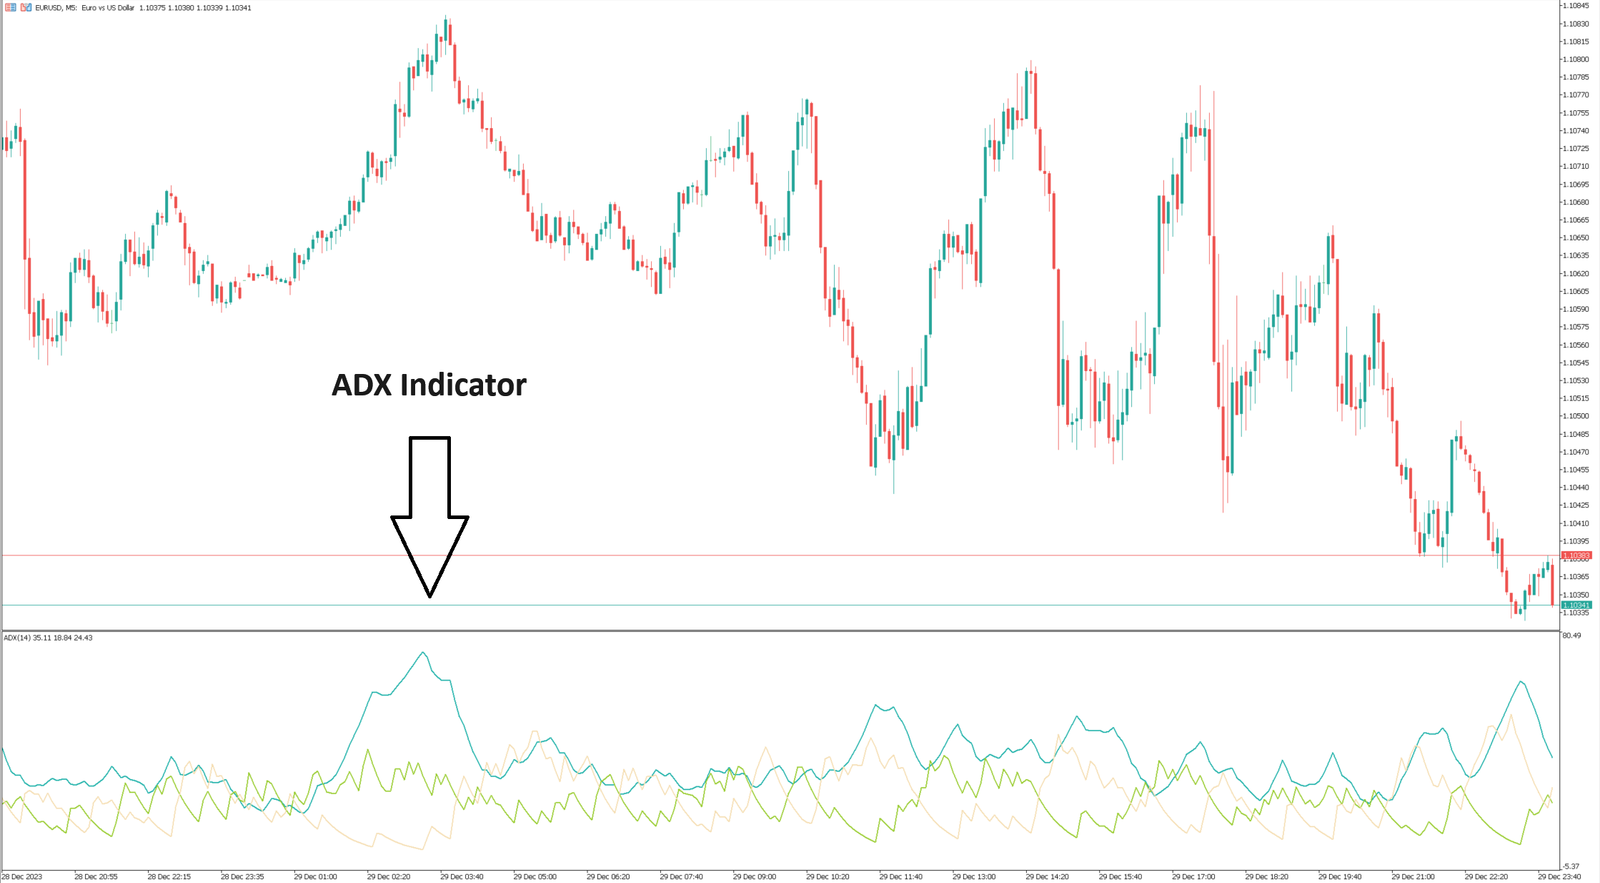
The ADX indicator is a comprehensive index, including positive index (+DI, green line) and
Negative (-DI, red line). If you want to test trends, you can use the entire ADX system.
The curve (thick line) of the ADX indicator reflects the strength of the trend (under the condition that there is a trend):
1-A rise in the ADX indicator (ADX above 25 usually indicates a trend) proves the strength of the trend is rising – it is recommended to use a trend index;
2-ADX indicator is down – the probability of trend development is low. ADX below 20 proves the lack of trend – it is recommended to use the oscillator.
Using the exponents of +DI and -DI, we recommend using additional exponents:
1-+DI (green line) exceeds -DI (red line) – buy signal;
2–DI (red line) exceeds +DI (green line) – sell signal.