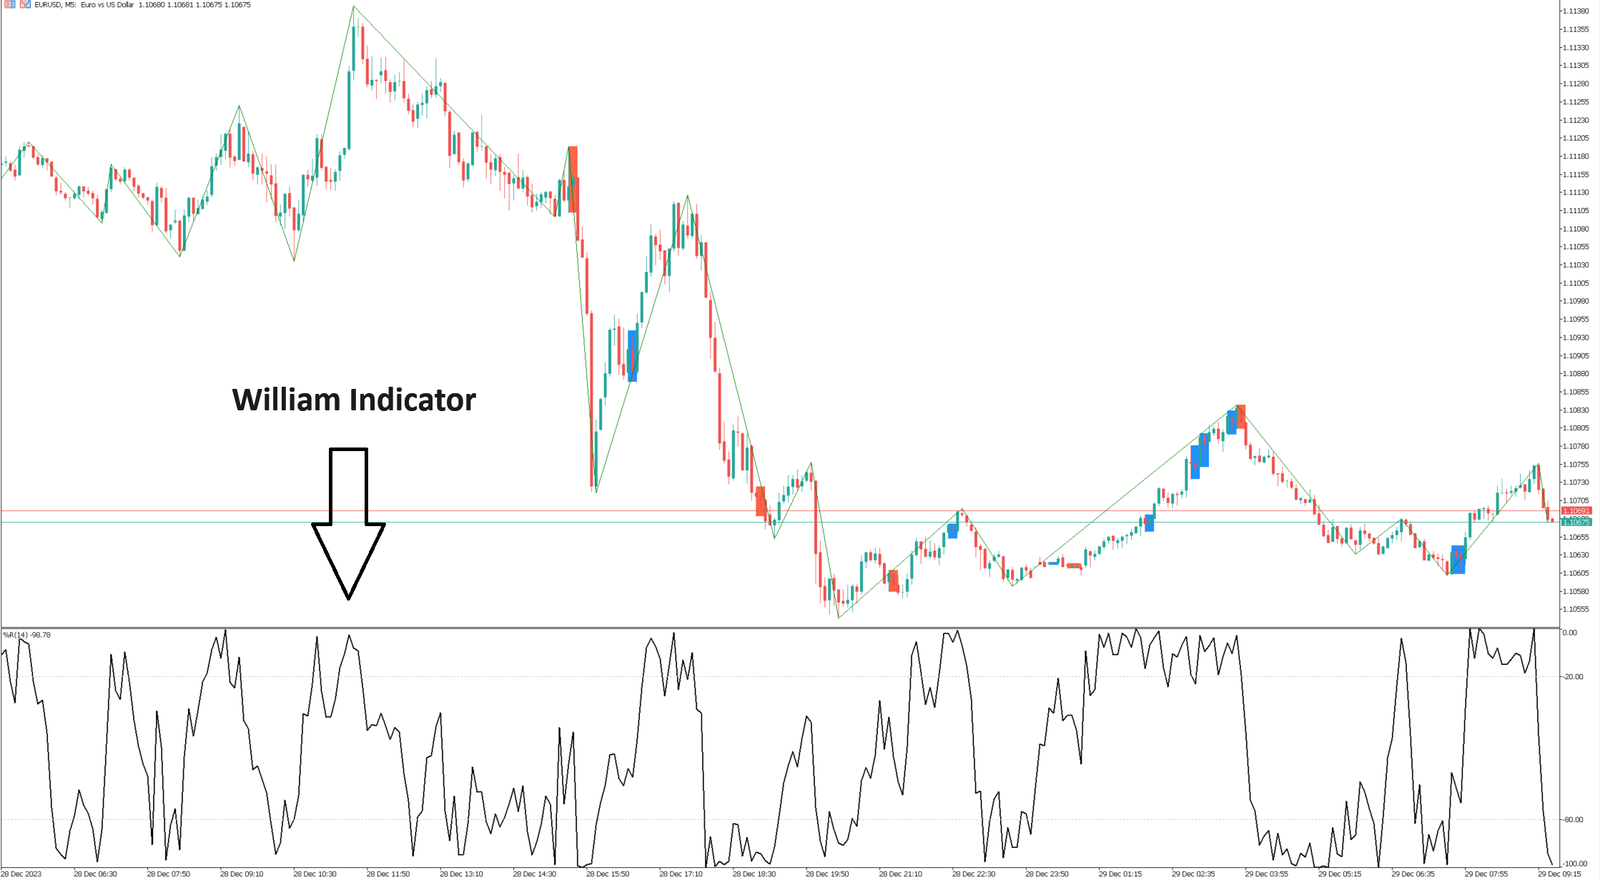
The Williams Percent Indicator (%R) was invented by Larry Williams and is used to prove that an asset is overbought/oversold and to identify possible turning points in a trend. Different from the stochastic indicator, the William indicator has a line under it, which is calculated according to the inverted scale.
Use of William % Indicator
The William Percent indicator can be used to determine overbought/oversold conditions for an asset, but this indicator needs to be used together with ordinary trend analysis:
1-The indicator exceeds the -20 level – the possibility of the asset being overbought;
2-Indicator below -80 level – possibility of oversold asset.
Indicators leave the overbought/oversold range – a possible sign of a trend turn:
1-The indicator crosses the overbought range from top to bottom – a sell signal;
2-The indicator crosses the oversold range from bottom to top – a buy signal.
Divergence situations are uncommon, but may prove to be weakness of the prevailing trend:
1-Indicator fluctuations do not support the price reaching its usual maximum value – a signal of weakness in the upward trend;
2-Indicator fluctuations did not support the price reaching routine lows – a sign of weakness in the downtrend.