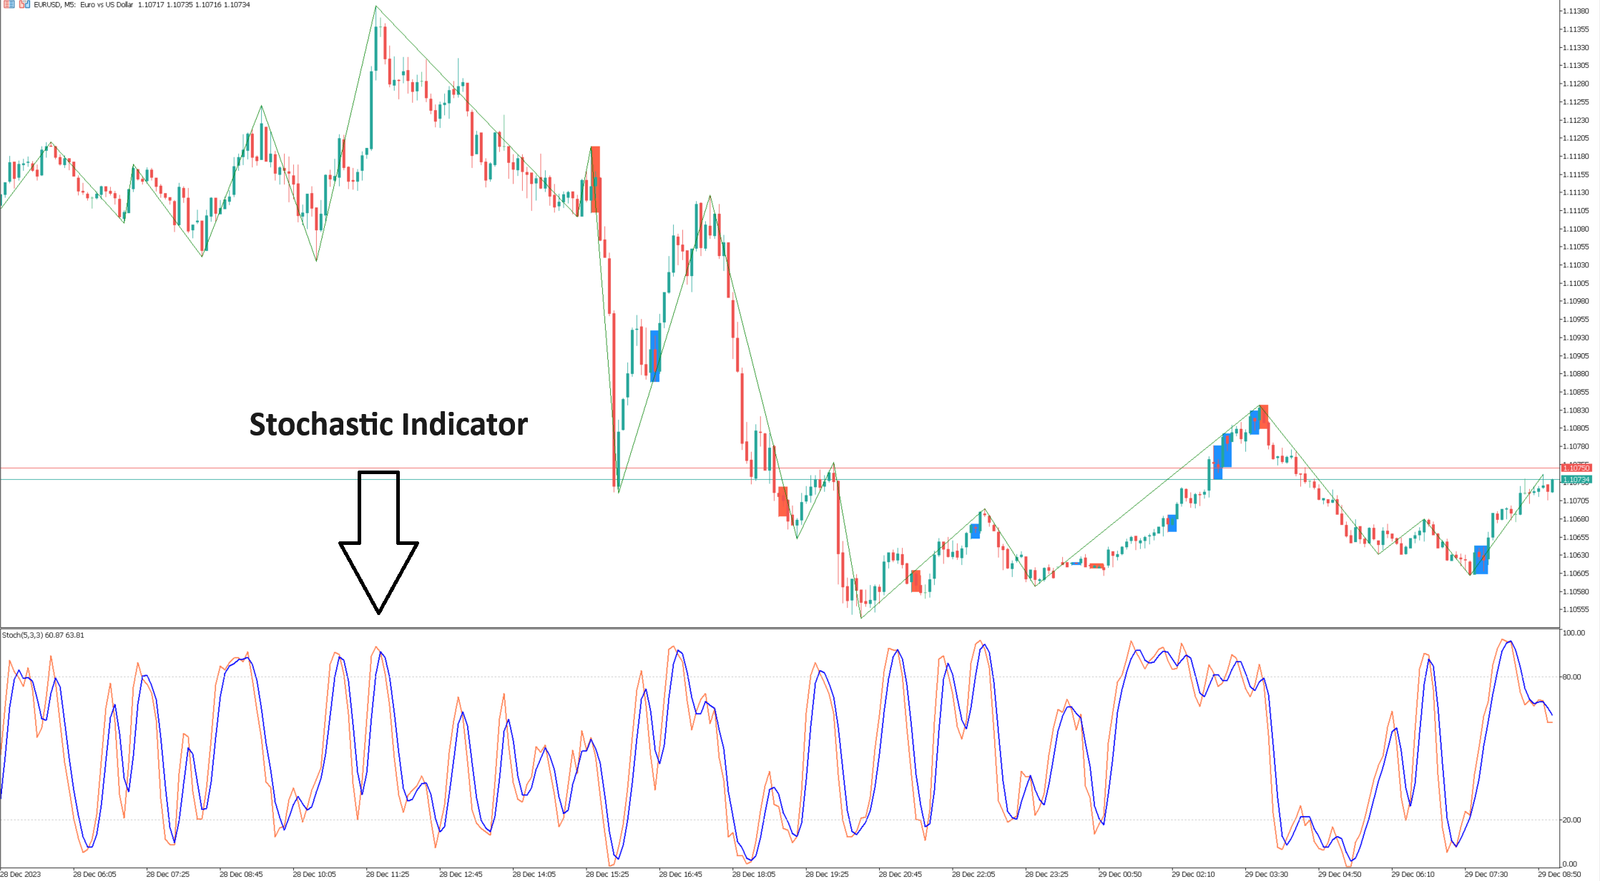
The Stochastic indicator is associated with George Lane, who used the indicator to determine price trends and possible turning points. The indicator determines the level of the current closing price within the range of recent periods. The main meaning is: when the price is on an upward trend, the price wants to reach the upper limit of the range/when the price is on a downward trend. Price wants to reach the lower end of the range.
Use of Stochastic Indicator
The stochastic indicator can be used to determine the overbought/oversold status of an asset, but this indicator needs to be used together with general trend analysis:
1-The indicator exceeds the 75 level – the possibility of the asset being overbought;
2-The indicator is below the 25 level – the possibility of the asset being oversold.
The indicator leaves the overbought/oversold zone – a characteristic that may prove a trend turn:
1-The indicator crosses the overbought range from top to bottom – a sell signal;
2-The indicator crosses the oversold range from bottom to top – a buy signal.
The indicator crossing the signal line (always the indicator’s 3-period line) is also a signal for opening a position:
1-The indicator crosses the signal line from top to bottom – a sell signal;
2-Indicators from the bottom up – a buy signal.
Convergence/divergence situations have the potential to prove superior trend weakness:
1-Indicator fluctuations do not support the price reaching its usual maximum value – a signal of weakness in the upward trend;
2-Indicator fluctuations did not support the price reaching routine lows – a sign of weakness in the downtrend.
Applications of the Stochastic Oscillator
The stochastic oscillator has the following effects: In an upward trend, the closing price is close to the top of the price range; when in a downward trend, the closing price is close to the bottom of the range.
The Stochastic oscillator makes use of 2 lines: %K and %D. %K – fast line, %D – slow line. The fluctuation range is from 0 to 100. The main signal is to look at D and the dispersion of the price. When there is a bearish divergence, D is above 80, the oscillator has formed 2 rising minimums, while the price continues to move downward. When K and D intersect, it is a signal for short and long. When K crosses the D line from top to bottom, it is a signal for short. When the K line crosses the D line from bottom to top, it is a long signal.