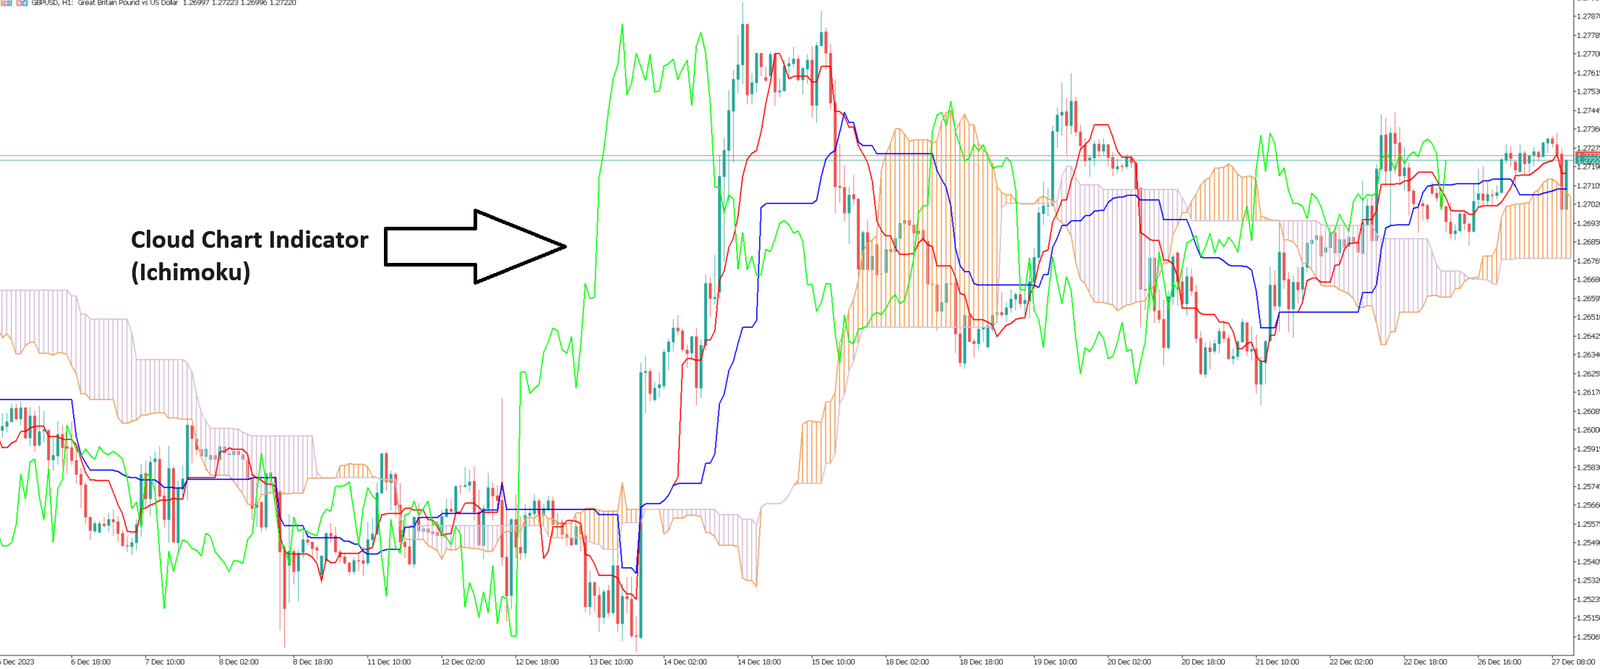
The Ichimoku indicator was invented by Tokyo commentator Goichi Hosoda in 1968. The Cloud Chart indicator is designed to quickly obtain a trend situation, including its dynamics and strength, from the perspective of cyclical nature and human behavior through five components, combined with price fluctuation analysis.
Use of Ichimoku
The cloud indicator (Ichimoku) has five lines of support or resistance, and the intersection of the five lines is an additional signal:
1-Tenkan-Sen (turning line, blue)
2-Kijun-Sen (baseline, red)
3- Senkou Span A (first online (line A), the green edge of the clouds)
4- Senkou Span B (first online (line B), the red edge of the clouds)
5-Chikou Span (delay line, green)
Clouds are the main element of the Cloud Chart indicator. Line A and line B form the resistance and support levels of the cloud indicator. Determination of trends and price adjustments:
1-Price fluctuations on the cloud – rising trend
2- Quotation price fluctuates under the cloud – downward trend
3-Internal fluctuations in the price cloud – sideways trend
4-Green cloud turns red – Sideways within an uptrend.
5-Red cloud turns green – Sideways within a downtrend.
Determination of support and resistance:
1-The first upper line (line A) serves as the first support line for the upward trend.
2-The first upper line (line B) serves as the second support line for the upward trend
3-The leading upper line (line A) serves as the first resistance line for the downward trend.
4-The leading upper line (line B) serves as the second resistance line for the downtrend.
Strong buy/sell signals on the cloud:
1-Tenkansen line crosses the base line from bottom to top – a buy signal.
2-Tenkansen line crosses the base line from top to bottom – a sell signal.
Weak buy/sell signals within the cloud:
1-Tenkansen line crosses the base line from bottom to top – a buy signal.
2- Tenkansen line crosses the base line from top to bottom – a sell signal.