The Relative Volatility Index was invented by John Ehlers and is used to identify prevailing trends. The basic meaning of index fluctuation is: the closing price of an upward trend is mostly higher than the opening price Chromium, and the closing price of a downward trend is lower than the opening price Chromium.
Use of Vigor Index
The Relative Volatility Index indicates the acceleration or deceleration of changes in price volatility (and can then be used to determine patterns of divergence/convergence)
1-Generally speaking, the higher the indicator, the stronger the price increase;
2-The lower the indicator, the stronger the price decline.
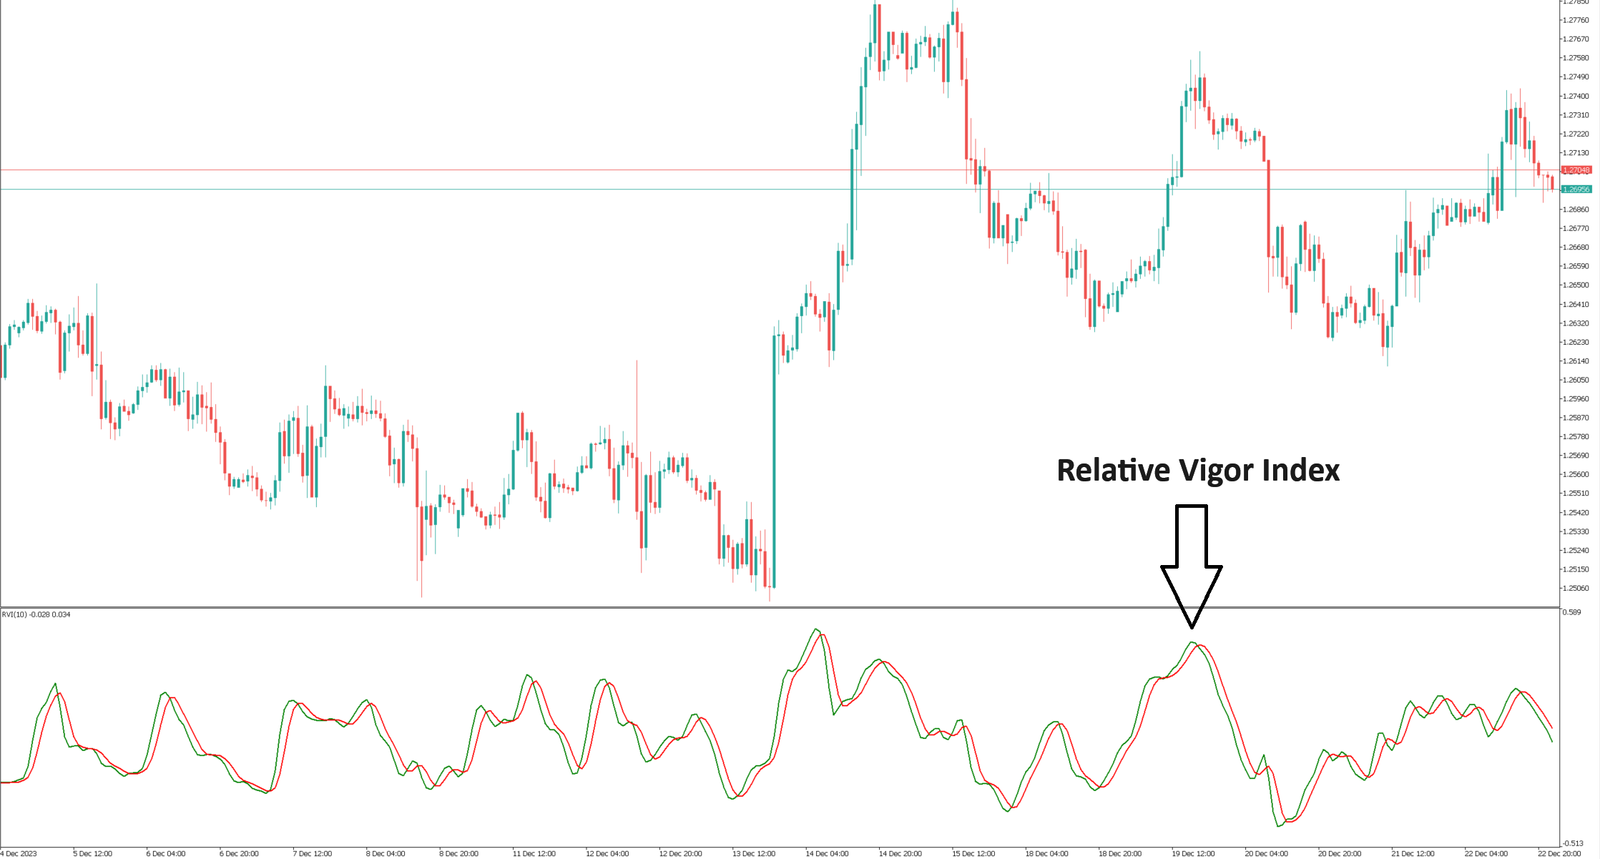
The indicator’s 4-stage line (red signal line) and the relative volatility index are used together, which is very convenient for determining the breaking point of price fluctuations.
1-The indicator crosses the signal line from top to bottom – a sell signal;
2-The indicator crosses the signal line from bottom to top – a buy signal.
Calculate
Relative Volatility Index(1) = (Closing – Opening) / (Highest Value – Lowest Value)
Relative Volatility Index(10) = 10-period SMA of Relative Volatility Index(1)